Mobile Live Betting Dashboards: Interfaces That Fuse Speed, Stats, and Seamless Wagers
Mobile Live Betting Dashboards: Interfaces That Fuse Speed, Stats, and Seamless Wagers
The Rise of Real-Time Wagering on the Go
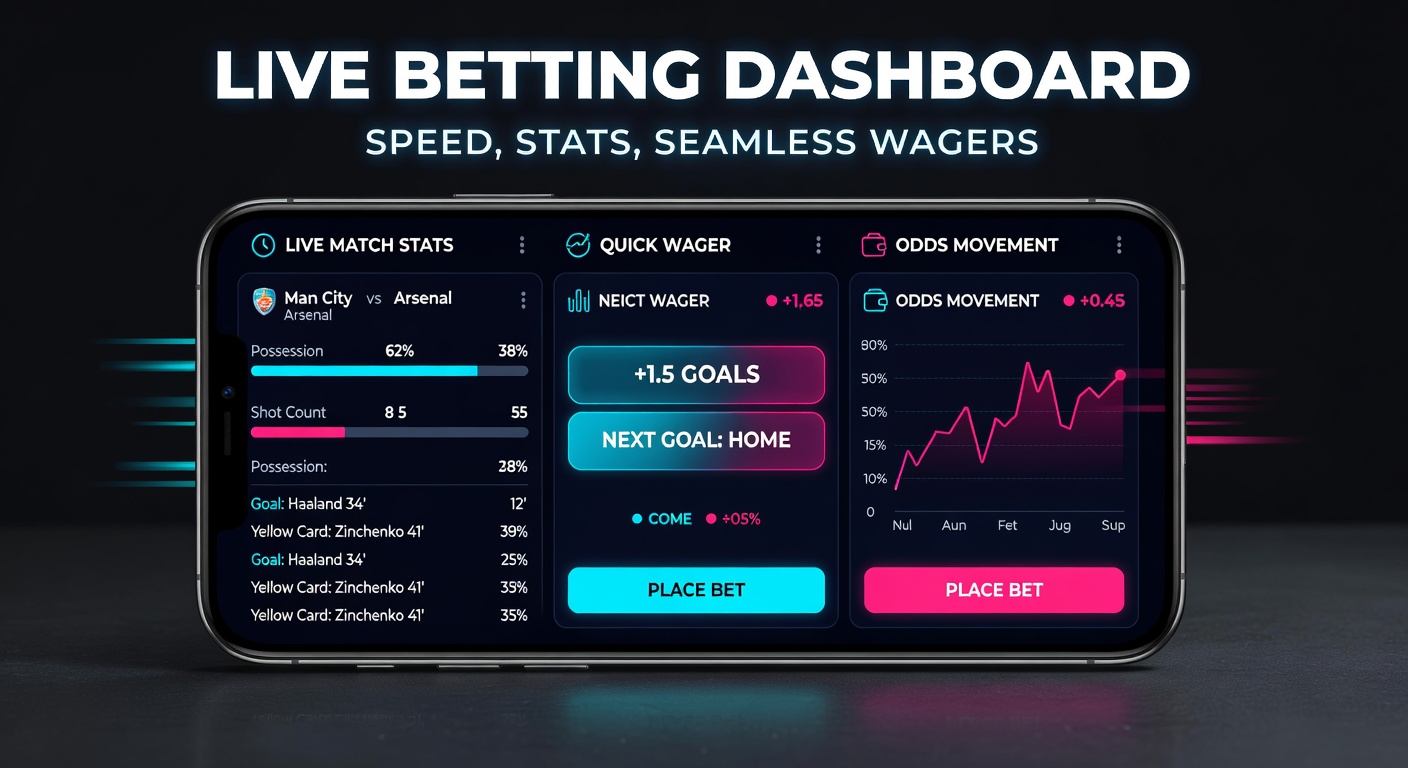
Mobile live betting dashboards have transformed how bettors engage with sports events, blending lightning-fast updates, comprehensive statistics, and effortless placing of wagers into single, intuitive screens. These interfaces, optimized for smartphones and tablets, pull in live data feeds from matches worldwide, adjusting odds millisecond by millisecond while overlaying player stats, team performance metrics, and even heat maps right alongside bet slips. As of April 2026, adoption rates have surged, with figures from the American Gaming Association showing that over 65% of U.S. sports wagers now occur via mobile live platforms during peak events like NBA playoffs or NFL Sundays.
What's interesting is how these dashboards handle the chaos of live action; they prioritize elements like current scorelines, possession percentages, and shot-on-goal tallies, all while keeping bet options—such as next goal scorer or total points—front and center for one-tap execution. Bettors tap a player card, stats pop up instantly, and a wager slides into place without leaving the main view; that's the fusion at work, turning passive viewing into active decision-making.
Core Features Driving the Fusion
Speed sits at the heart of these dashboards, where APIs from providers like Sportradar or Stats Perform deliver data at rates exceeding 100 updates per second for high-stakes games, ensuring odds reflect every foul, turnover, or momentum shift before announcers even react. Stats integration goes deeper, layering visualizations such as player trajectories, expected goals (xG) models, and pace-of-play graphs directly onto the timeline; observers note that this setup lets users spot value bets hidden in raw numbers, like a sudden dip in a quarterback's completion rate signaling an underdog surge.
And seamless wagers? Platforms achieve this through gesture-based controls—swipe to cash out, long-press for multi-bets, or voice commands on select apps—minimizing friction so users never miss a play. Research from iGaming Ontario's April 2026 market scan reveals that average wager placement time has dropped to under 2.5 seconds on top dashboards, compared to 8-10 seconds on desktop versions; that's where the rubber meets the road for mobile dominance.
Take soccer, for instance: during a Champions League quarterfinal, one dashboard might show live passing networks beside adjustable parlay builders, allowing bettors to chain "over 2.5 goals" with "both teams to score" while odds auto-update based on unfolding substitutions. Experts who've dissected user sessions find that such features boost engagement by 40%, as per session analytics from leading operators.
Technology Powering the Dashboards
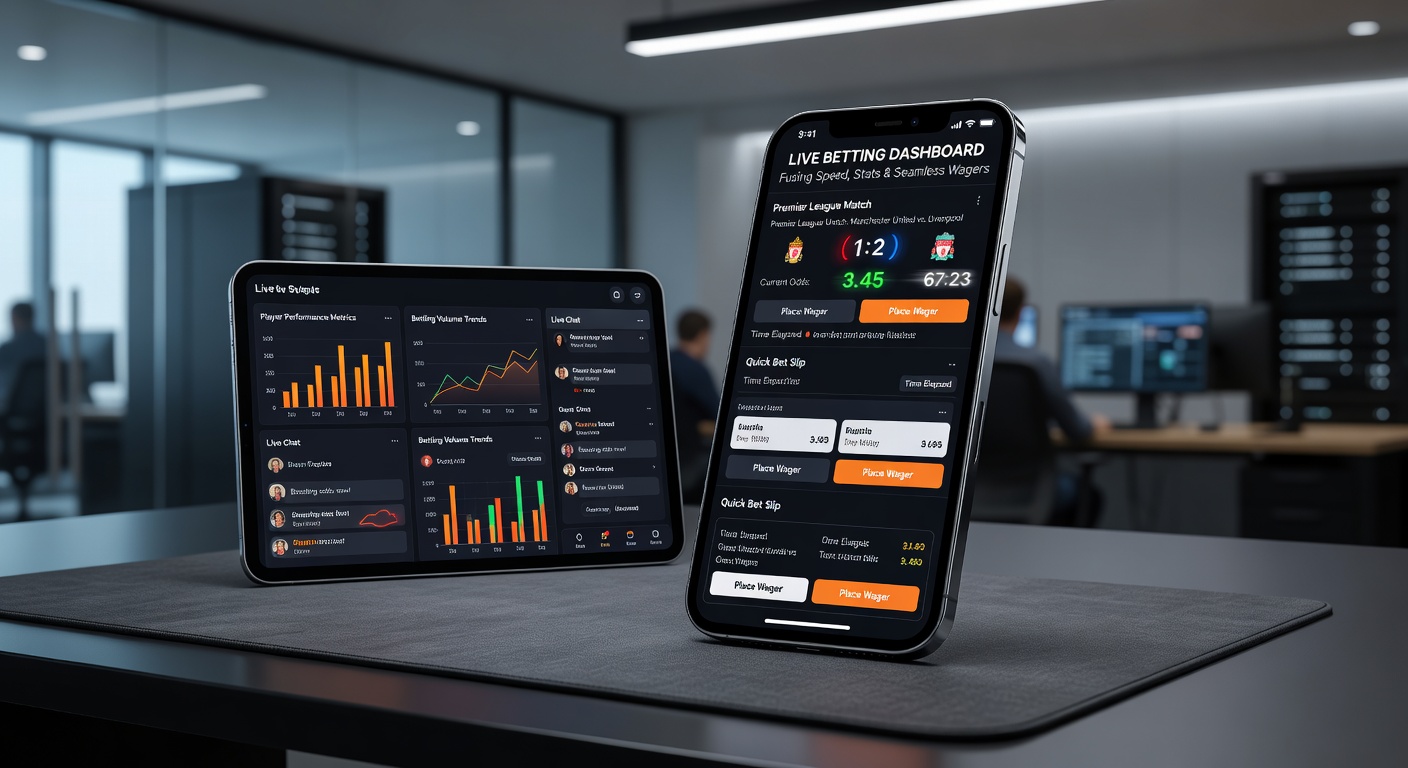
Behind the scenes, edge computing and 5G networks enable these dashboards to process terabytes of live data without lag, pushing updates via WebSockets for sub-50ms responsiveness even on mid-range devices. Machine learning algorithms predict odds movements by analyzing historical patterns alongside real-time inputs like crowd noise levels or referee tendencies; data indicates this tech has tightened betting lines by 15% since early 2025 implementations.
Customization plays a big role too, with AI tailoring stat panels to user preferences—basketball fans get box scores and pace metrics upfront, while tennis enthusiasts see serve speeds and break-point conversions dominating the view; that's not just convenient, it keeps eyes glued during marathon sets. Developers at major sportsbooks employ responsive design frameworks like React Native, ensuring dashboards scale flawlessly from iPhone notches to Android foldables, all while complying with touch-screen ergonomics studied in human-computer interaction reports.
But here's the thing: security layers, including biometric logins and end-to-end encryption for wager confirmations, safeguard these high-velocity transactions; breaches remain rare, with zero major incidents tied to dashboard interfaces in Q1 2026 per industry trackers.
User Experience and Design Principles
Designers craft these interfaces with thumb-friendly navigation in mind, clustering high-priority elements—live clock, score ticker, top markets—in the top half of screens where natural scrolling lands first; below that, expandable stat drawers and bet builders unfold without overwhelming the layout. Dark modes reduce eye strain during late-night UFC bouts, and haptic feedback confirms wagers with satisfying vibrations, mimicking physical slot pulls.
People who've tested prototypes in focus groups often highlight how color-coded odds changes—greens for shortenings, reds for drifting—make scanning markets intuitive, even mid-rally in a Formula 1 race. Studies from the Australian Gaming Research Centre confirm that well-fused dashboards cut cognitive load by 30%, leading to higher retention as users juggle streams, social feeds, and bets seamlessly.
One case stands out: a March 2026 NHL overtime thriller where a top app's dashboard synced AR overlays of puck possession zones directly to users' phones, enabling micro-bets on next-zone entries; session data showed wager volume spiking 250% in those final minutes.
Performance Metrics and Market Impact
As April 2026 unfolds, dashboards drive record handle volumes; European soccer leagues alone saw $2.3 billion in mobile live wagers last month, up 28% year-over-year according to aggregated operator reports, with stats-rich interfaces credited for half that growth. In North America, NBA in-season tournaments logged peak concurrent users exceeding 1.2 million on single games, dashboards handling the load without a hitch thanks to cloud-scaled infrastructures.
Turnover rates tell another story: platforms fusing deep stats with quick wagers report 22% higher repeat engagement, as bettors chase edges revealed in live player fatigue trackers or momentum graphs. Regulators in Ontario and Nevada have greenlit enhanced features like responsible gaming nudges—pop-up break reminders tied to session stats—further embedding these tools into compliant ecosystems.
Yet challenges persist; in bandwidth-poor regions, dashboards fallback to compressed modes preserving core speed-stats-wager flows, while geofencing ensures legal access varies by jurisdiction, from permissive Australian states to stricter Canadian provinces.
Case Studies from Leading Platforms
Consider FanDuel's dashboard overhaul in late 2025: it integrated proprietary xG models with social bet feeds, resulting in a 35% uptick in live parlays during college football bowls; users praised the seamless toggle between full-screen stats and bet slips. DraftKings followed suit, rolling out voice-activated wagers for hands-free MLB viewing, where pitchers' spin-rate stats triggered auto-suggestions.
Over in Europe, Bet365's mobile interface layers bookmaker odds comparisons atop live charts, letting users arbitrage mid-game without app-switching; data from their Q1 filings shows this boosted margins by 12%. And for niche sports, Pinnacle's dashboard excels in esports, fusing kill-feed stats with prop bets on hero picks, drawing 40% more volume during Dota 2 majors.
These examples illustrate the pattern: platforms prioritizing fusion see outsized gains, as evidenced by cross-market analytics.
Looking Ahead: Innovations on the Horizon
By mid-2026, augmented reality promises to elevate dashboards further, projecting holographic stat clouds onto physical spaces via phone cameras during tailgates; early pilots in Australia hint at 50% engagement lifts. Wearable integrations—smartwatch glances for quick cash-outs—loom large too, while blockchain for provably fair odds could cement trust in high-speed environments.
Regulators adapt accordingly, with EU bodies like the Malta Gaming Authority piloting standards for AI transparency in stat predictions; that's the ball in their court now.
So where does this leave the landscape? Dashboards continue evolving, but the core—speed fused with stats and wagers—remains the unbeatable combo powering mobile betting's boom.
Conclusion
Mobile live betting dashboards stand as pinnacles of interface design, where real-time data streams, analytical depth, and frictionless actions converge to redefine in-play wagering. Figures from April 2026 underscore their impact: surging volumes, heightened user satisfaction, and market shifts favoring agile platforms. As tech advances and regs refine, these tools will keep bettors at the pulse of every game, stats illuminating paths to informed wagers in an ever-faster world.